Bar chart
A bar chart or bar graph is a chart with rectangular bars with lengths proportional to the valuesthat they represent. The bars can be plotted vertically or horizontally. Bar charts are used for plotting discrete (or discontinuous) data; that is data which has discrete value and is not continuous. Bar graphs consist of an axis and a series of labelled horizontal or vertical bars that show different values for each bar. The numbers along a side of the bar graph are called the scale. The important point to note about bar graphs is their bar length or height - the greater their length or height, the greater their value.
ILLUSTRATION 2:
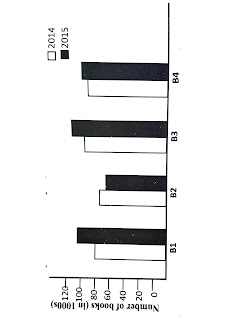
The bar graph given here gives the sales of books (in 1000 numbers) from 6 branches of a publication company during two consecutive years 2014 and 2015.
 |
| fig:Bar Chart Studyy the graph and choose the wrong optionfrom the following? |
(a) B4 sold more books in 2014 than that of B1 in 2015
(b) B3 sold more books than B2 in 2014.
(c) For B2, books sold in 2014 is more than that in 2015.
(d) Total books sold in 2015 is more than that sold in 2014.
Let us check each of the options.
Consider (a):
Wrong Since B1 sold more than 100 books in 2015 and B4 sold less than 100 books in 2014.
Consider (b):
Correct. Since B3 sold more than 80 books in 2014 and B2 sold less than 80 books in 2014.
Consider (c):
Correct. Since B2 sold more than 70 books in 2014 and B2 sold less than 70 books in 2014.
Consider (d):
Correct. Clear from the graph
bar in 2014.
as 3 out of 4 bars of 2015 have greater length than their corresponding